
文章目录
- 基于项目中对柱状图使用的各种情况,Echarts提供的组件不太能满足业务记录设备历史数据的需求,对其研究会花费大量的时间,为了提高研发的速度,我这里对柱状图进行二次封装,以便满足业务需求,可直接使用。
- Echarts官方文档
-
- Echarts提供了基于npm引入的方式,因此我们只需要执行npm指令将可以将Echarts引入到我们的项目中去了 npm install echarts --save
- window.echarts = require("echarts");
- **注意:**必须给存储容器的div高度,否则不显示
- <div class="chart"> <div class="chart_one" ref="chart"></div> </div>
- data() { return { dateTime: "", //七日之前日期时间 newDateTime: "", //现在日期时间 dateRes: [], //柱状图地X轴日期 dayTime: "", //每日工作时间 showdateArr: [], //点击对应日期的时间页面展示对应日期 showdate: "", //页面展示点击对应的柱状图之后对用的日期 isRepeatClick: 6, year: "", //7天之前的年份 month: "", //7天之前的月份 day: "", //7天之前的日 newYear: "", //当天的年份 newMonth: "", //当天的月份 newDay: "", //当日 dateMonth: "", //英文模式下页面展示当月 dateDay: "", //英文模式下页面展示当日 seriesData: [15, 20, 55, 8, 12, 24, 10], //七天工作时间 sumTime: 0, //总工作时长 averageTime: 0, //平均时长 }; },
- this.getStandardDateBeforeWeek(); this.formateDateArr(); this.dayTime = this.seriesData[6]; //默认展示当天工作时间
- let myChart = echarts.init(this.$refs.chart);
- let option = { animation: true, //动画 tooltip: { trigger: "axis", // 触发类型 'item'图形触发:散点图,饼图等无类目轴的图表中使用; 'axis'坐标轴触发;'none':什么都不触发。 showContent: false, axisPointer: { // 坐标轴指示器配置项。 type: "none", // 'line' 直线指示器 'shadow' 阴影指示器 'none' 无指示器 'cross' 十字准星指示器。 }, }, xAxis: { data: this.dateRes, axisTick: { show: false, }, //x轴文字的配置 axisLabel: { show: true, color: this.isDarkMode ? "rgba(255,255,255,0.6)" : "rgba(0,0,0,0.4)", fontSize: 10, //更改坐标轴文字大小 fontWeight: "normal", }, axisLine: { show: true, lineStyle: { color: this.isDarkMode ? "rgba(255,255,255,0.05)" : "rgba(0,0,0,0.05)", }, }, }, grid: { top: "14%", left: "5%", right: "5%", bottom: "7%", containLabel: true, }, yAxis: { position: "right", // interval: 10, //设置刻度间距 // minInterval: 10, //分割线配置 splitLine: { show: true, lineStyle: { color: this.isDarkMode ? "rgba(255,255,255,0.05)" : "rgba(0,0,0,0.05)", }, }, //y轴文字配置 axisLabel: { color: this.isDarkMode ? "rgba(255,255,255,0.6)" : "rgba(0,0,0,0.4)", fontSize: 10, //更改坐标轴文字大小 }, }, series: [ { barWidth: 8, //柱状的宽度 type: "bar", //类型 data: this.seriesData, //数据 z: 999, itemStyle: { //柱状圆角 borderRadius: [15, 15, 0, 0], // (顺时针左上,右上,右下,左下) color: (params) => { if (params.dataIndex === 6) { return this.isDarkMode ? "#5291FF" : "#0A59F7"; } else { return this.isDarkMode ? "rgba(82, 145, 255, 0.4)" : "rgba(10, 89, 247, 0.4)"; } }, }, markLine: { symbol: "none", label: { show: false, }, data: [ { lineStyle: { type: "solid", width: 1, color: "#D0D0D0", }, xAxis: this.dateRes[6].value, }, ], }, }, ], };
- option && myChart.setOption(option);
- myChart.getZr().on("click", (params) => { //获取点击指定的柱子下标 let Index = myChart.convertFromPixel({ seriesIndex: 0 }, [ params.offsetX, params.offsetY, ])[0]; if (Index < 0) { Index = 0; } if (Index > 6) { Index = 6; } if (Index === this.isRepeatClick) { return; } else { this.isRepeatClick = Index; //清除图表 myChart.clear(); let option = { animation: false, tooltip: { trigger: "axis", // 触发类型 'item'图形触发:散点图,饼图等无类目轴的图表中使用; 'axis'坐标轴触发;'none':什么都不触发。 showContent: false, axisPointer: { // 坐标轴指示器配置项。 type: "none", // 'line' 直线指示器 'shadow' 阴影指示器 'none' 无指示器 'cross' 十字准星指示器。 }, }, xAxis: { data: this.dateRes, axisTick: { show: false, }, //x轴文字的配置 axisLabel: { show: true, color: this.isDarkMode ? "rgba(255,255,255,0.6)" : "rgba(0,0,0,0.4)", fontSize: 10, //更改坐标轴文字大小 fontWeight: "normal", }, axisLine: { show: true, lineStyle: { color: this.isDarkMode ? "rgba(255,255,255,0.05)" : "rgba(0,0,0,0.05)", }, }, }, grid: { top: "14%", left: "5%", right: "5%", bottom: "7%", containLabel: true, }, yAxis: { position: "right", // interval: 10, //设置刻度间距 // minInterval: 10, //分割线配置 splitLine: { show: true, lineStyle: { color: "rgba(0,0,0,0.05)", }, }, //y轴文字配置 axisLabel: { color: this.isDarkMode ? "rgba(255,255,255,0.6)" : "rgba(0,0,0,0.4)", fontSize: 10, //更改坐标轴文字大小 }, }, series: [ { barWidth: 8, //柱状的宽度 type: "bar", //类型 data: this.seriesData, //数据 z: 999, itemStyle: { //柱状圆角 borderRadius: [15, 15, 0, 0], // (顺时针左上,右上,右下,左下) color: (params) => { //判断选中的名字改变柱子的颜色样式 if (Index === params.dataIndex) { return this.isDarkMode ? "#5291FF" : "#0A59F7"; } else { return this.isDarkMode ? "rgba(82, 145, 255, 0.4)" : "rgba(10, 89, 247, 0.4)"; } }, }, markLine: { symbol: "none", label: { show: false, }, data: [ { lineStyle: { type: "solid", width: 1, color: "#D0D0D0", }, xAxis: this.dateRes[Index], }, ], }, }, ], }; //重新绘制图表 option && myChart.setOption(option); //给整个柱子增加点击事件 let pointInPixel = [params.offsetX, params.offsetY]; if (myChart.containPixel("grid", pointInPixel)) { let xIndex = myChart.convertFromPixel({ seriesIndex: 0 }, [ params.offsetX, params.offsetY, ])[0]; let op = myChart.getOption(); let name = op.xAxis[0].data[xIndex]; //获取X轴name this.dayTime = this.seriesData[xIndex]; //将点击之后日期对应的工作时间展示在页面 this.showdate = this.showdateArr[xIndex]; //中文模式下将点击之后的日期展示在页面 this.dateMonth = this.showdate.slice(0, 2); //英文模式下点击之后的日期展示在页面 this.dateDay = this.showdate.slice(3, 5); //英文模式下点击之后的日期展示在页面 this.dateRes.forEach((v, i) => { //单击选中的字体加粗 if (v === name) { this.dateRes[i] = { value: v, textStyle: { fontWeight: "400", color: this.isDarkMode ? "rgba(255,255,255,0.9)" : "rgba(0,0,0,0.9)", }, }; } else { if (v.value) { this.dateRes[i] = v.value; } else { this.dateRes[i] = v; } } }); //将修改之后的X轴字体样式渲染到页面 myChart.setOption({ xAxis: { data: this.dateRes, }, }); } } });
- formateDateArr() { for (let i = 0; i < 7; i++) { let time = new Date(new Date().setDate(new Date().getDate() + i - 6)); let month = `${time.getMonth() + 1}`.slice(-2); let day = `${time.getDate()}`.slice(-2); if (i === 6) { this.dateRes.push({ value: month + "/" + day, textStyle: { fontWeight: "400", color: this.isDarkMode ? "rgba(255,255,255,0.9)" : "rgba(0,0,0,0.9)", }, }); } else { this.dateRes.push(month + "/" + day); } if (day < 10) { day = "0" + day; } if (month < 10) { month = "0" + month; } this.showdateArr.push(`${month}月${day}日`); } },
- getStandardDateBeforeWeek() { let date = new Date(); date.setDate(date.getDate() - 6); //获取特定某天日期 this.year = date.getFullYear(); //获取年 this.month = date.getMonth() + 1; //获取月 this.day = date.getDate(); //获取当日 if (this.day < 10) { this.day = "0" + this.day; } if (this.month < 10) { this.month = "0" + this.month; } this.dateTime = `${this.year}年${this.month}月${this.day}日`; //组合时间 date.setDate(date.getDate() + 6); this.newDay = date.getDate(); //获取当日 this.newMonth = date.getMonth() + 1; //获取当月 this.newYear = date.getFullYear(); //获取年 if (this.newDay < 10) { this.newDay = "0" + this.newDay; } if (this.newMonth < 10) { this.newMonth = "0" + this.newMonth; } if (this.newYear === this.year) { this.newDateTime = `${this.newMonth}月${this.newDay}日`; } else { this.newDateTime = `${this.newYear}年${this.newMonth}月${this.newDay}日`; //跨年则增加年份展示 } this.showdate = `${this.newMonth}月${this.newDay}日`; //默认展示当天日期 this.dateMonth = this.newMonth; //英文模式下页面展示的当前月份 this.dateDay = this.newDay; //英文模式下页面展示的当前日 },
- 本文主要解决官网柱状图不满足记录设备历史数据业务需求,重新对柱状图做了二次修改Demo,希望能给大家提供帮助,如果大家觉得能帮助到自己,希望大家能够动动手指点个赞。
- 入门到精通、技巧到案例,系统化分享HarmonyOS开发技术,欢迎投稿和订阅,让我们一起携手前行共建鸿蒙生态。 想了解更多关于开源的内容,请访问: 51CTO 开源基础软件社区 https://ost.51cto.com/#bkwz
作者:杨雷,基于项目中对柱状图使用的各种情况,Echarts提供的组件不太能满足业务记录设备历史数据的需求,对其研究会花费大量的时间,为了提高研发的速度,我这里对柱状图进行二次封装,以便满足业务需求,可直接使用。,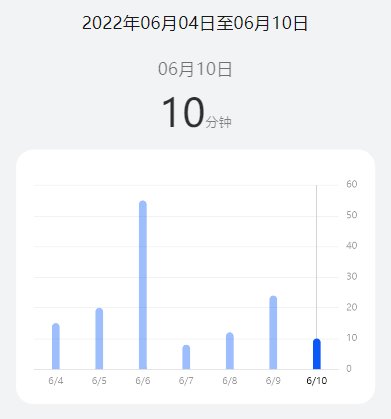 ,Echarts官方文档,Echarts提供了基于npm引入的方式,因此我们只需要执行npm指令将可以将Echarts引入到我们的项目中去了,**注意:**必须给存储容器的div高度,否则不显示,本文主要解决官网柱状图不满足记录设备历史数据业务需求,重新对柱状图做了二次修改Demo,希望能给大家提供帮助,如果大家觉得能帮助到自己,希望大家能够动动手指点个赞。,入门到精通、技巧到案例,系统化分享HarmonyOS开发技术,欢迎投稿和订阅,让我们一起携手前行共建鸿蒙生态。,想了解更多关于开源的内容,请访问:,51CTO 开源基础软件社区,https://ost.51cto.com/#bkwz,
作者:杨雷
基于项目中对柱状图使用的各种情况,Echarts提供的组件不太能满足业务记录设备历史数据的需求,对其研究会花费大量的时间,为了提高研发的速度,我这里对柱状图进行二次封装,以便满足业务需求,可直接使用。
Echarts提供了基于npm引入的方式,因此我们只需要执行npm指令将可以将Echarts引入到我们的项目中去了
npm install echarts --save
window.echarts = require("echarts");
window.echarts = require("echarts");
**注意:**必须给存储容器的div高度,否则不显示
<div class="chart">
 <div class="chart_one" ref="chart"></div>
</div>
<div class="chart">
<div class="chart_one" ref="chart"></div>
</div>
 data() {
 return {
 dateTime: "", //七日之前日期时间
 newDateTime: "", //现在日期时间
 dateRes: [], //柱状图地X轴日期
 dayTime: "", //每日工作时间
 showdateArr: [], //点击对应日期的时间页面展示对应日期
 showdate: "", //页面展示点击对应的柱状图之后对用的日期
 isRepeatClick: 6,
 year: "", //7天之前的年份
 month: "", //7天之前的月份
 day: "", //7天之前的日
 newYear: "", //当天的年份
 newMonth: "", //当天的月份
 newDay: "", //当日
 dateMonth: "", //英文模式下页面展示当月
 dateDay: "", //英文模式下页面展示当日
 seriesData: [15, 20, 55, 8, 12, 24, 10], //七天工作时间
 sumTime: 0, //总工作时长
 averageTime: 0, //平均时长
 };
 },
data() {
return {
dateTime: "", //七日之前日期时间
newDateTime: "", //现在日期时间
dateRes: [], //柱状图地X轴日期
dayTime: "", //每日工作时间
showdateArr: [], //点击对应日期的时间页面展示对应日期
showdate: "", //页面展示点击对应的柱状图之后对用的日期
isRepeatClick: 6,
year: "", //7天之前的年份
month: "", //7天之前的月份
day: "", //7天之前的日
newYear: "", //当天的年份
newMonth: "", //当天的月份
newDay: "", //当日
dateMonth: "", //英文模式下页面展示当月
dateDay: "", //英文模式下页面展示当日
seriesData: [15, 20, 55, 8, 12, 24, 10], //七天工作时间
sumTime: 0, //总工作时长
averageTime: 0, //平均时长
};
},
this.getStandardDateBeforeWeek();
this.formateDateArr();
this.dayTime = this.seriesData[6]; //默认展示当天工作时间
this.getStandardDateBeforeWeek();
this.formateDateArr();
this.dayTime = this.seriesData[6]; //默认展示当天工作时间
let myChart = echarts.init(this.$refs.chart);
let myChart = echarts.init(this.$refs.chart);
let option = {
 animation: true, //动画
 tooltip: {
 trigger: "axis", // 触发类型 'item'图形触发:散点图,饼图等无类目轴的图表中使用; 'axis'坐标轴触发;'none':什么都不触发。
 showContent: false,
 axisPointer: {
 // 坐标轴指示器配置项。
 type: "none", // 'line' 直线指示器 'shadow' 阴影指示器 'none' 无指示器 'cross' 十字准星指示器。
 },
 },
 xAxis: {
 data: this.dateRes,
 axisTick: {
 show: false,
 },
 //x轴文字的配置
 axisLabel: {
 show: true,
 color: this.isDarkMode ? "rgba(255,255,255,0.6)" : "rgba(0,0,0,0.4)",
 fontSize: 10, //更改坐标轴文字大小
 fontWeight: "normal",
 },
 axisLine: {
 show: true,
 lineStyle: {
 color: this.isDarkMode
 ? "rgba(255,255,255,0.05)"
 : "rgba(0,0,0,0.05)",
 },
 },
 },
 grid: {
 top: "14%",
 left: "5%",
 right: "5%",
 bottom: "7%",
 containLabel: true,
 },
 yAxis: {
 position: "right",
 // interval: 10, //设置刻度间距
 // minInterval: 10,
 //分割线配置
 splitLine: {
 show: true,
 lineStyle: {
 color: this.isDarkMode
 ? "rgba(255,255,255,0.05)"
 : "rgba(0,0,0,0.05)",
 },
 },
 //y轴文字配置
 axisLabel: {
 color: this.isDarkMode ? "rgba(255,255,255,0.6)" : "rgba(0,0,0,0.4)",
 fontSize: 10, //更改坐标轴文字大小
 },
 },
 series: [
 {
 barWidth: 8, //柱状的宽度
 type: "bar", //类型
 data: this.seriesData, //数据
 z: 999,
 itemStyle: {
 //柱状圆角
 borderRadius: [15, 15, 0, 0], // (顺时针左上,右上,右下,左下)
 color: (params) => {
 if (params.dataIndex === 6) {
 return this.isDarkMode ? "#5291FF" : "#0A59F7";
 } else {
 return this.isDarkMode
 ? "rgba(82, 145, 255, 0.4)"
 : "rgba(10, 89, 247, 0.4)";
 }
 },
 },
 markLine: {
 symbol: "none",
 label: {
 show: false,
 },
 data: [
 {
 lineStyle: {
 type: "solid",
 width: 1,
 color: "#D0D0D0",
 },
 xAxis: this.dateRes[6].value,
 },
 ],
 },
 },
 ],
 };
let option = {
animation: true, //动画
tooltip: {
trigger: "axis", // 触发类型 'item'图形触发:散点图,饼图等无类目轴的图表中使用; 'axis'坐标轴触发;'none':什么都不触发。
showContent: false,
axisPointer: {
// 坐标轴指示器配置项。
type: "none", // 'line' 直线指示器 'shadow' 阴影指示器 'none' 无指示器 'cross' 十字准星指示器。
},
},
xAxis: {
data: this.dateRes,
axisTick: {
show: false,
},
//x轴文字的配置
axisLabel: {
show: true,
color: this.isDarkMode ? "rgba(255,255,255,0.6)" : "rgba(0,0,0,0.4)",
fontSize: 10, //更改坐标轴文字大小
fontWeight: "normal",
},
axisLine: {
show: true,
lineStyle: {
color: this.isDarkMode
? "rgba(255,255,255,0.05)"
: "rgba(0,0,0,0.05)",
},
},
},
grid: {
top: "14%",
left: "5%",
right: "5%",
bottom: "7%",
containLabel: true,
},
yAxis: {
position: "right",
// interval: 10, //设置刻度间距
// minInterval: 10,
//分割线配置
splitLine: {
show: true,
lineStyle: {
color: this.isDarkMode
? "rgba(255,255,255,0.05)"
: "rgba(0,0,0,0.05)",
},
},
//y轴文字配置
axisLabel: {
color: this.isDarkMode ? "rgba(255,255,255,0.6)" : "rgba(0,0,0,0.4)",
fontSize: 10, //更改坐标轴文字大小
},
},
series: [
{
barWidth: 8, //柱状的宽度
type: "bar", //类型
data: this.seriesData, //数据
z: 999,
itemStyle: {
//柱状圆角
borderRadius: [15, 15, 0, 0], // (顺时针左上,右上,右下,左下)
color: (params) => {
if (params.dataIndex === 6) {
return this.isDarkMode ? "#5291FF" : "#0A59F7";
} else {
return this.isDarkMode
? "rgba(82, 145, 255, 0.4)"
: "rgba(10, 89, 247, 0.4)";
}
},
},
markLine: {
symbol: "none",
label: {
show: false,
},
data: [
{
lineStyle: {
type: "solid",
width: 1,
color: "#D0D0D0",
},
xAxis: this.dateRes[6].value,
},
],
},
},
],
};
option && myChart.setOption(option);
option && myChart.setOption(option);
 myChart.getZr().on("click", (params) => {
 //获取点击指定的柱子下标
 let Index = myChart.convertFromPixel({ seriesIndex: 0 }, [
 params.offsetX,
 params.offsetY,
 ])[0];
 if (Index < 0) {
 Index = 0;
 }
 if (Index > 6) {
 Index = 6;
 }
 if (Index === this.isRepeatClick) {
 return;
 } else {
 this.isRepeatClick = Index;
 //清除图表
 myChart.clear();
 let option = {
 animation: false,
 tooltip: {
 trigger: "axis", // 触发类型 'item'图形触发:散点图,饼图等无类目轴的图表中使用; 'axis'坐标轴触发;'none':什么都不触发。
 showContent: false,
 axisPointer: {
 // 坐标轴指示器配置项。
 type: "none", // 'line' 直线指示器 'shadow' 阴影指示器 'none' 无指示器 'cross' 十字准星指示器。
 },
 },
 xAxis: {
 data: this.dateRes,
 axisTick: {
 show: false,
 },
 //x轴文字的配置
 axisLabel: {
 show: true,
 color: this.isDarkMode
 ? "rgba(255,255,255,0.6)"
 : "rgba(0,0,0,0.4)",
 fontSize: 10, //更改坐标轴文字大小
 fontWeight: "normal",
 },
 axisLine: {
 show: true,
 lineStyle: {
 color: this.isDarkMode
 ? "rgba(255,255,255,0.05)"
 : "rgba(0,0,0,0.05)",
 },
 },
 },
 grid: {
 top: "14%",
 left: "5%",
 right: "5%",
 bottom: "7%",
 containLabel: true,
 },
 yAxis: {
 position: "right",
 // interval: 10, //设置刻度间距
 // minInterval: 10,
 //分割线配置
 splitLine: {
 show: true,
 lineStyle: {
 color: "rgba(0,0,0,0.05)",
 },
 },
 //y轴文字配置
 axisLabel: {
 color: this.isDarkMode
 ? "rgba(255,255,255,0.6)"
 : "rgba(0,0,0,0.4)",
 fontSize: 10, //更改坐标轴文字大小
 },
 },
 series: [
 {
 barWidth: 8, //柱状的宽度
 type: "bar", //类型
 data: this.seriesData, //数据
 z: 999,
 itemStyle: {
 //柱状圆角
 borderRadius: [15, 15, 0, 0], // (顺时针左上,右上,右下,左下)
 color: (params) => {
 //判断选中的名字改变柱子的颜色样式
 if (Index === params.dataIndex) {
 return this.isDarkMode ? "#5291FF" : "#0A59F7";
 } else {
 return this.isDarkMode
 ? "rgba(82, 145, 255, 0.4)"
 : "rgba(10, 89, 247, 0.4)";
 }
 },
 },
 markLine: {
 symbol: "none",
 label: {
 show: false,
 },
 data: [
 {
 lineStyle: {
 type: "solid",
 width: 1,
 color: "#D0D0D0",
 },
 xAxis: this.dateRes[Index],
 },
 ],
 },
 },
 ],
 };
 //重新绘制图表
 option && myChart.setOption(option);
 //给整个柱子增加点击事件
 let pointInPixel = [params.offsetX, params.offsetY];
 if (myChart.containPixel("grid", pointInPixel)) {
 let xIndex = myChart.convertFromPixel({ seriesIndex: 0 }, [
 params.offsetX,
 params.offsetY,
 ])[0];
 let op = myChart.getOption();
 let name = op.xAxis[0].data[xIndex]; //获取X轴name
 this.dayTime = this.seriesData[xIndex]; //将点击之后日期对应的工作时间展示在页面
 this.showdate = this.showdateArr[xIndex]; //中文模式下将点击之后的日期展示在页面
 this.dateMonth = this.showdate.slice(0, 2); //英文模式下点击之后的日期展示在页面
 this.dateDay = this.showdate.slice(3, 5); //英文模式下点击之后的日期展示在页面
 this.dateRes.forEach((v, i) => {
 //单击选中的字体加粗
 if (v === name) {
 this.dateRes[i] = {
 value: v,
 textStyle: {
 fontWeight: "400",
 color: this.isDarkMode
 ? "rgba(255,255,255,0.9)"
 : "rgba(0,0,0,0.9)",
 },
 };
 } else {
 if (v.value) {
 this.dateRes[i] = v.value;
 } else {
 this.dateRes[i] = v;
 }
 }
 });
 //将修改之后的X轴字体样式渲染到页面
 myChart.setOption({
 xAxis: {
 data: this.dateRes,
 },
 });
 }
 }
 });
myChart.getZr().on("click", (params) => {
//获取点击指定的柱子下标
let Index = myChart.convertFromPixel({ seriesIndex: 0 }, [
params.offsetX,
params.offsetY,
])[0];
if (Index < 0) {
Index = 0;
}
if (Index > 6) {
Index = 6;
}
if (Index === this.isRepeatClick) {
return;
} else {
this.isRepeatClick = Index;
//清除图表
myChart.clear();
let option = {
animation: false,
tooltip: {
trigger: "axis", // 触发类型 'item'图形触发:散点图,饼图等无类目轴的图表中使用; 'axis'坐标轴触发;'none':什么都不触发。
showContent: false,
axisPointer: {
// 坐标轴指示器配置项。
type: "none", // 'line' 直线指示器 'shadow' 阴影指示器 'none' 无指示器 'cross' 十字准星指示器。
},
},
xAxis: {
data: this.dateRes,
axisTick: {
show: false,
},
//x轴文字的配置
axisLabel: {
show: true,
color: this.isDarkMode
? "rgba(255,255,255,0.6)"
: "rgba(0,0,0,0.4)",
fontSize: 10, //更改坐标轴文字大小
fontWeight: "normal",
},
axisLine: {
show: true,
lineStyle: {
color: this.isDarkMode
? "rgba(255,255,255,0.05)"
: "rgba(0,0,0,0.05)",
},
},
},
grid: {
top: "14%",
left: "5%",
right: "5%",
bottom: "7%",
containLabel: true,
},
yAxis: {
position: "right",
// interval: 10, //设置刻度间距
// minInterval: 10,
//分割线配置
splitLine: {
show: true,
lineStyle: {
color: "rgba(0,0,0,0.05)",
},
},
//y轴文字配置
axisLabel: {
color: this.isDarkMode
? "rgba(255,255,255,0.6)"
: "rgba(0,0,0,0.4)",
fontSize: 10, //更改坐标轴文字大小
},
},
series: [
{
barWidth: 8, //柱状的宽度
type: "bar", //类型
data: this.seriesData, //数据
z: 999,
itemStyle: {
//柱状圆角
borderRadius: [15, 15, 0, 0], // (顺时针左上,右上,右下,左下)
color: (params) => {
//判断选中的名字改变柱子的颜色样式
if (Index === params.dataIndex) {
return this.isDarkMode ? "#5291FF" : "#0A59F7";
} else {
return this.isDarkMode
? "rgba(82, 145, 255, 0.4)"
: "rgba(10, 89, 247, 0.4)";
}
},
},
markLine: {
symbol: "none",
label: {
show: false,
},
data: [
{
lineStyle: {
type: "solid",
width: 1,
color: "#D0D0D0",
},
xAxis: this.dateRes[Index],
},
],
},
},
],
};
//重新绘制图表
option && myChart.setOption(option);
//给整个柱子增加点击事件
let pointInPixel = [params.offsetX, params.offsetY];
if (myChart.containPixel("grid", pointInPixel)) {
let xIndex = myChart.convertFromPixel({ seriesIndex: 0 }, [
params.offsetX,
params.offsetY,
])[0];
let op = myChart.getOption();
let name = op.xAxis[0].data[xIndex]; //获取X轴name
this.dayTime = this.seriesData[xIndex]; //将点击之后日期对应的工作时间展示在页面
this.showdate = this.showdateArr[xIndex]; //中文模式下将点击之后的日期展示在页面
this.dateMonth = this.showdate.slice(0, 2); //英文模式下点击之后的日期展示在页面
this.dateDay = this.showdate.slice(3, 5); //英文模式下点击之后的日期展示在页面
this.dateRes.forEach((v, i) => {
//单击选中的字体加粗
if (v === name) {
this.dateRes[i] = {
value: v,
textStyle: {
fontWeight: "400",
color: this.isDarkMode
? "rgba(255,255,255,0.9)"
: "rgba(0,0,0,0.9)",
},
};
} else {
if (v.value) {
this.dateRes[i] = v.value;
} else {
this.dateRes[i] = v;
}
}
});
//将修改之后的X轴字体样式渲染到页面
myChart.setOption({
xAxis: {
data: this.dateRes,
},
});
}
}
});
formateDateArr() {
 for (let i = 0; i < 7; i++) {
 let time = new Date(new Date().setDate(new Date().getDate() + i - 6));
 let month = `${time.getMonth() + 1}`.slice(-2);
 let day = `${time.getDate()}`.slice(-2);
 if (i === 6) {
 this.dateRes.push({
 value: month + "/" + day,
 textStyle: {
 fontWeight: "400",
 color: this.isDarkMode
 ? "rgba(255,255,255,0.9)"
 : "rgba(0,0,0,0.9)",
 },
 });
 } else {
 this.dateRes.push(month + "/" + day);
 }
 if (day < 10) {
 day = "0" + day;
 }
 if (month < 10) {
 month = "0" + month;
 }
 this.showdateArr.push(`${month}月${day}日`);
 }
 },
formateDateArr() {
for (let i = 0; i < 7; i++) {
let time = new Date(new Date().setDate(new Date().getDate() + i - 6));
let month = `${time.getMonth() + 1}`.slice(-2);
let day = `${time.getDate()}`.slice(-2);
if (i === 6) {
this.dateRes.push({
value: month + "/" + day,
textStyle: {
fontWeight: "400",
color: this.isDarkMode
? "rgba(255,255,255,0.9)"
: "rgba(0,0,0,0.9)",
},
});
} else {
this.dateRes.push(month + "/" + day);
}
if (day < 10) {
day = "0" + day;
}
if (month < 10) {
month = "0" + month;
}
this.showdateArr.push(`${month}月${day}日`);
}
},
getStandardDateBeforeWeek() {
 let date = new Date();
 date.setDate(date.getDate() - 6); //获取特定某天日期
 this.year = date.getFullYear(); //获取年
 this.month = date.getMonth() + 1; //获取月
 this.day = date.getDate(); //获取当日
 if (this.day < 10) {
 this.day = "0" + this.day;
 }
 if (this.month < 10) {
 this.month = "0" + this.month;
 }
 this.dateTime = `${this.year}年${this.month}月${this.day}日`; //组合时间
 date.setDate(date.getDate() + 6);
 this.newDay = date.getDate(); //获取当日
 this.newMonth = date.getMonth() + 1; //获取当月
 this.newYear = date.getFullYear(); //获取年
 if (this.newDay < 10) {
 this.newDay = "0" + this.newDay;
 }
 if (this.newMonth < 10) {
 this.newMonth = "0" + this.newMonth;
 }
 if (this.newYear === this.year) {
 this.newDateTime = `${this.newMonth}月${this.newDay}日`;
 } else {
 this.newDateTime = `${this.newYear}年${this.newMonth}月${this.newDay}日`; //跨年则增加年份展示
 }
 this.showdate = `${this.newMonth}月${this.newDay}日`; //默认展示当天日期
 this.dateMonth = this.newMonth; //英文模式下页面展示的当前月份
 this.dateDay = this.newDay; //英文模式下页面展示的当前日
 },
getStandardDateBeforeWeek() {
let date = new Date();
date.setDate(date.getDate() - 6); //获取特定某天日期
this.year = date.getFullYear(); //获取年
this.month = date.getMonth() + 1; //获取月
this.day = date.getDate(); //获取当日
if (this.day < 10) {
this.day = "0" + this.day;
}
if (this.month < 10) {
this.month = "0" + this.month;
}
this.dateTime = `${this.year}年${this.month}月${this.day}日`; //组合时间
date.setDate(date.getDate() + 6);
this.newDay = date.getDate(); //获取当日
this.newMonth = date.getMonth() + 1; //获取当月
this.newYear = date.getFullYear(); //获取年
if (this.newDay < 10) {
this.newDay = "0" + this.newDay;
}
if (this.newMonth < 10) {
this.newMonth = "0" + this.newMonth;
}
if (this.newYear === this.year) {
this.newDateTime = `${this.newMonth}月${this.newDay}日`;
} else {
this.newDateTime = `${this.newYear}年${this.newMonth}月${this.newDay}日`; //跨年则增加年份展示
}
this.showdate = `${this.newMonth}月${this.newDay}日`; //默认展示当天日期
this.dateMonth = this.newMonth; //英文模式下页面展示的当前月份
this.dateDay = this.newDay; //英文模式下页面展示的当前日
},
本文主要解决官网柱状图不满足记录设备历史数据业务需求,重新对柱状图做了二次修改Demo,希望能给大家提供帮助,如果大家觉得能帮助到自己,希望大家能够动动手指点个赞。
入门到精通、技巧到案例,系统化分享HarmonyOS开发技术,欢迎投稿和订阅,让我们一起携手前行共建鸿蒙生态。
https://ost.51cto.com/#bkwz
© 版权声明
文章版权归作者所有,未经允许请勿转载。